Monte Carlo simulation was named for Monte Carlo, the second smallest country in the world, where the attractions are casinos containing games of chance.
Both, casino and simulation use the element of chance, so that the result occurs in the long run. To generate the element of chance, Monte Carlo simulation methods typically use random numbers.
An individual realization is not statistical significant, but in the long run, the simulation will approach equilibrium values.
The Monte Carlo method is used in many diverse fields:
- Nuclear Reactor Design
- Energy physics
- Traffic Flow
- Dow-Jones forecasting
- Oil-Well explorations
- Economics
- Portfolio Management
- Simulation of the outcome of games
- Simulation of complex physical phenomena
For betting on sport Monte Carlo simulation helps you to understand the likelihood of successfully achieving your goals, given the investments you have set up specifically for those goals.
An easy written introduction to Monte Carlo Method is fond in the book "Calculated Bets". The Author used the method to build a promising model for betting on Jai Ala matches.
Calculating the probability that a team/player wins the tournament with Monte Carlo Simulation the tournament rules (knockout tournament ...) and the function to determinet the winner from the probabilities for head to head matches, build the model.
For every match the winner is determined by random with the function of the probabilities for head to head matches. With the tournament rules (schedule) the next matches for the winner and loser was determined. This procedure was done iteratively until the statistics (frequent of winning or each player) will approach equilibrium values.
So the tournament is simulated approximately 100000 times depending on the size and the number of matches remaining.
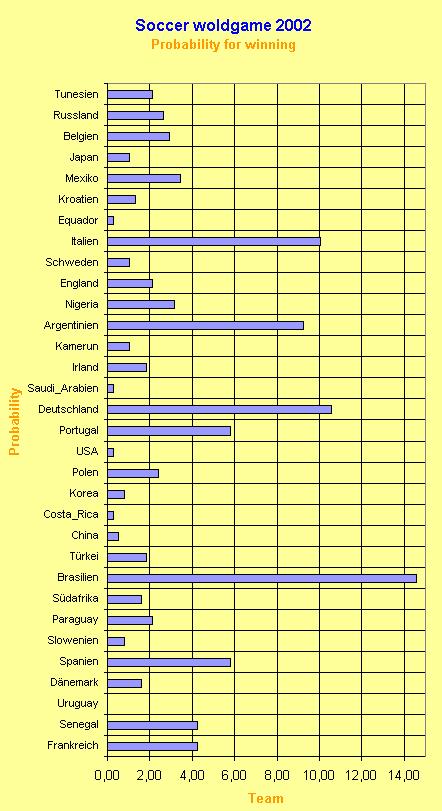
Example1: Model for predicting the winner of the soccer world game 2002. The model was build with the discrete simulation packages emPlant from Tecnomatix. For the probabilities for head to head matches a poison distribution was used. The parameter for the distribution is the average number of goals of the team score in a match. The data where collected form previous matches and adjusted from a soccer expert.
Bild 1 emplant Modell

Bild 2 Diagramm soccer winning
|
Team |
Prob Winner % |
Prob Second % |
Prob in last Round % |
fair odds |
| Frankreich |
4,23 |
2,65 |
43,11 |
23,66 |
| Senegal |
4,23 |
3,97 |
84,13 |
23,65 |
| Uruguay |
0,00 |
0,00 |
7,67 |
|
| Dänemark |
1,59 |
4,23 |
65,08 |
62,97 |
| Spanien |
5,82 |
8,99 |
83,33 |
17,18 |
| Slowenien |
0,79 |
0,79 |
22,22 |
125,94 |
| Paraguay |
2,12 |
1,59 |
47,35 |
47,17 |
| Südafrika |
1,59 |
1,86 |
47,10 |
62,89 |
| Brasilien |
14,55 |
7,68 |
92,33 |
6,87 |
| Türkei |
1,85 |
1,06 |
43,40 |
54,05 |
| China |
0,53 |
0,00 |
11,11 |
189,39 |
| Costa_Rica |
0,26 |
2,64 |
53,16 |
378,79 |
| Korea |
0,79 |
1,85 |
64,01 |
126,26 |
| Polen |
2,38 |
1,85 |
25,13 |
41,95 |
| USA |
0,26 |
0,53 |
60,85 |
378,79 |
| Portugal |
5,82 |
5,29 |
50,01 |
17,18 |
| Deutschland |
10,57 |
7,14 |
93,39 |
9,46 |
| Saudi_Arabien |
0,26 |
1,33 |
19,05 |
378,79 |
| Irland |
1,85 |
2,91 |
48,41 |
54,00 |
| Kamerun |
1,06 |
2,91 |
39,15 |
94,70 |
| Argentinien |
9,27 |
8,46 |
69,84 |
10,79 |
| Nigeria |
3,18 |
1,33 |
41,54 |
31,49 |
| England |
2,12 |
2,65 |
69,04 |
47,21 |
| Schweden |
1,06 |
1,32 |
19,58 |
94,34 |
| Italien |
10,06 |
10,58 |
87,84 |
9,94 |
| Equador |
0,26 |
0,26 |
14,81 |
378,79 |
| Kroatien |
1,32 |
1,32 |
22,74 |
75,76 |
| Mexiko |
3,44 |
2,38 |
74,61 |
29,04 |
| Japan |
1,06 |
2,11 |
39,41 |
94,52 |
| Belgien |
2,91 |
3,18 |
56,61 |
34,39 |
| Russland |
2,65 |
5,29 |
78,84 |
37,74 |
| Tunesien |
2,11 |
1,85 |
25,13 |
47,35 |
Example 2: Tennis ATP men Austrailen Open 2003.
The model was implemented in C++. The probability for win a match was calculated from a Logistic Regression with the Elo-Ranking of the players.
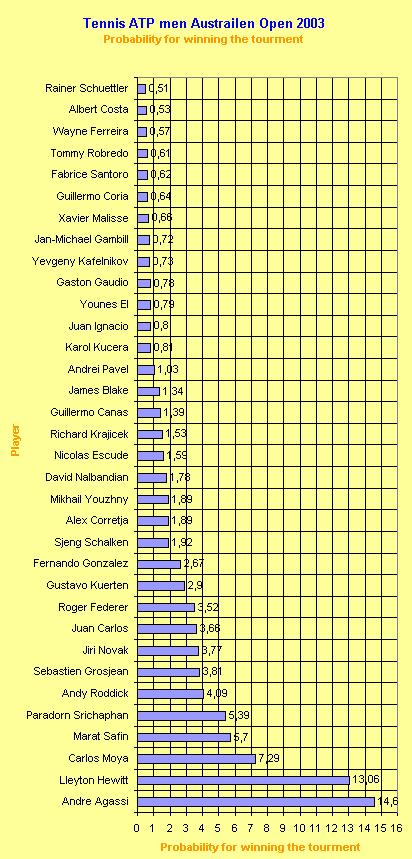 Bild Diagramm winning
| Name |
Probability win (%) |
fair odds winn |
Probability second (%) |
fair odds second |
ELO Ranking |
ELO Ranking surface |
real Place |
| Andre Agassi |
14,6 |
6,85 |
7,46 |
13,4 |
2181,3 |
2210,5 |
1 |
| Lleyton Hewitt |
13,06 |
7,66 |
7,33 |
13,64 |
2167 |
2148,7 |
|
| Carlos Moya |
7,29 |
13,71 |
5,56 |
18 |
2088,1 |
1960,5 |
|
| Marat Safin |
5,7 |
17,53 |
4,63 |
21,59 |
2076,7 |
2021,3 |
|
| Paradorn Srichaphan |
5,39 |
18,54 |
4,09 |
24,45 |
2088,6 |
1983,6 |
|
| Andy Roddick |
4,09 |
24,45 |
3,9 |
25,62 |
2040 |
2003 |
3 |
| Sebastien Grosjean |
3,81 |
26,21 |
3,58 |
27,97 |
2036,3 |
1879,6 |
4 |
| Jiri Novak |
3,77 |
26,55 |
3,57 |
28,04 |
2039,8 |
1960,3 |
|
| Juan Carlos |
3,66 |
27,32 |
3,46 |
28,9 |
2039,1 |
1999,5 |
4 |
| Roger Federer |
3,52 |
28,38 |
3,86 |
25,93 |
2009,3 |
1957,8 |
|
| Gustavo Kuerten |
2,9 |
34,45 |
2,68 |
37,32 |
2048,8 |
2068,6 |
|
| Fernando Gonzalez |
2,67 |
37,38 |
3,2 |
31,29 |
1985,2 |
1956 |
|
| Sjeng Schalken |
1,92 |
52,04 |
2,56 |
39,04 |
1955,9 |
1854,5 |
|
| Alex Corretja |
1,89 |
53 |
2,15 |
46,49 |
1998,6 |
1910 |
|
| Mikhail Youzhny |
1,89 |
52,86 |
2,21 |
45,29 |
1990,1 |
1794,5 |
|
| David Nalbandian |
1,78 |
56,22 |
2,32 |
43,04 |
1961,5 |
1748,4 |
4 |
| Nicolas Escude |
1,59 |
62,76 |
2,1 |
47,68 |
1960,1 |
1876,6 |
|
| Richard Krajicek |
1,53 |
65,42 |
2,1 |
47,53 |
1954,8 |
1955,9 |
|
| Guillermo Canas |
1,39 |
72,06 |
1,7 |
58,87 |
1977,8 |
1931,2 |
|
| James Blake |
1,34 |
74,85 |
1,81 |
55,19 |
1954,6 |
1905 |
|
| Andrei Pavel |
1,03 |
96,89 |
1,63 |
61,44 |
1920,5 |
1855,6 |
|
| Karol Kucera |
0,81 |
123,96 |
1,24 |
80,35 |
1919,5 |
1899,1 |
|
| Juan Ignacio |
0,8 |
124,92 |
1,26 |
79,3 |
1917,9 |
1928 |
|
| Younes El |
0,79 |
127,36 |
1,16 |
85,85 |
1931,6 |
1948 |
4 |
| Gaston Gaudio |
0,78 |
127,42 |
1,03 |
96,78 |
1958,8 |
1845,9 |
|
| Yevgeny Kafelnikov |
0,73 |
137,4 |
1,1 |
90,98 |
1925 |
1968,8 |
|
| Jan-Michael Gambill |
0,72 |
138,48 |
1,13 |
88,35 |
1913,6 |
1949 |
|
| Xavier Malisse |
0,66 |
152,65 |
1,16 |
86,2 |
1898,1 |
1876,5 |
|
| Guillermo Coria |
0,64 |
156,27 |
0,98 |
102,27 |
1921 |
1927,5 |
|
| Fabrice Santoro |
0,62 |
160,41 |
1,07 |
93,25 |
1895 |
1926,1 |
|
| Tommy Robredo |
0,61 |
164,39 |
0,9 |
110,82 |
1936,9 |
1818,5 |
|
| Wayne Ferreira |
0,57 |
176,55 |
0,84 |
119,53 |
1931,7 |
1857,9 |
3 |
| Albert Costa |
0,53 |
187,9 |
0,97 |
103,39 |
1877,9 |
1794,9 |
|
| Rainer Schuettler |
0,51 |
195,58 |
0,86 |
116,62 |
1910,7 |
1938,3 |
2 |